This is a ‘visualizer’ for the 2018 paper “Relational mobility predicts social behaviors in 39 countries and is tied to historical farming and threat” by Thomson, Yuki, and the 25-person team that made the world relationships survey possible.
Take a Journey with Relational Mobility
Published in PNAS, you can see the open access paper here: http://www.pnas.org/cgi/doi/10.1073/pnas.1713191115
Poke, prod, and explore the data – it is freely available to download too.
The World Relationships Survey (WRS)
All relational mobility scores below were measured in the WRS, over multiple waves from late 2013 till mid-2016. The survey also included the interpersonal intimacy, self-disclosure, similarity, and social support measures. See the main paper (here) for details.

16,939
Participants

39
Countries
23
Languages

27
Collaborators
Relational Mobility Country Scores
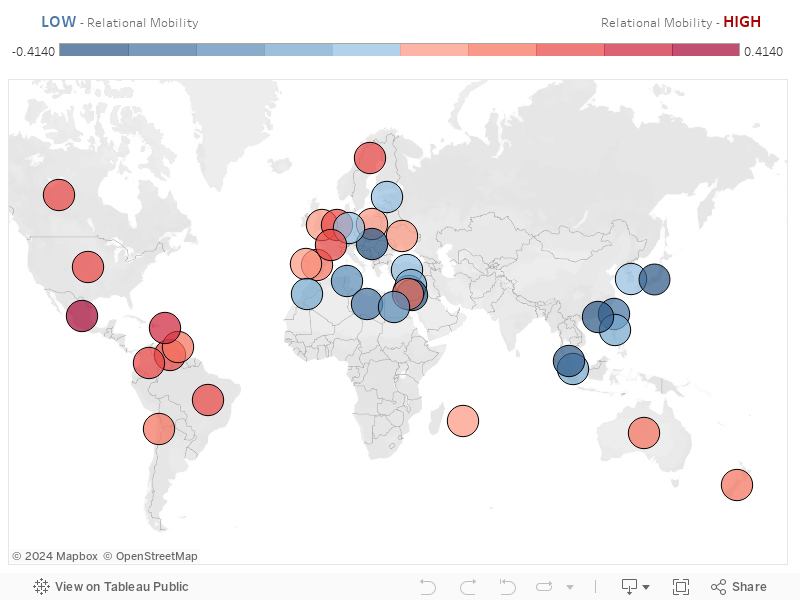
What countries and regions are high and low in relational mobility?
What do you notice? East and South-east Asia are low in relational mobility. So are many Arabic-speaking countries and regions. North America and Europe tend to be high in relational mobility.
Big, dark red circles are high relational mobility. Small, dark blue circles are low in relational mobility.
Data download via the Open Science Framework
- CSV: country-scores.csv
- Excel workbook: country-scores.xlsx
- SPSS datafile: country-scores.sav
Take note of the Latin American countries – they are high in relational mobility. From a cross-cultural psychology standpoint, this is interesting because South America has always been considered ‘collectivistic’. But as far as relational mobility is concerned, South America is even higher than the uber-individualistic North America!
Also take note of Hungary – Hungary is very low on relational mobility, but as you’ll see below, people in Hungary don’t act like people in other low relational mobility societies!
Source: Thomson et al. (2018), Table 1
Relational Mobility Convergent Validity
Are perceptions of relational mobility accurate?
Before moving on, let’s have a think about what the ‘relational mobility society scores’ are.
Essentially, they’re the average perception of relational mobility from the people we surveyed in each country or region (using the relational mobility scale). But what if people’s perceptions are wrong? What if in low relational mobility societies, for example, there are actually plenty of opportunities to change relationships, and people simply think otherwise?
To answer this question, we look at existing society-level variables that point to similar things as relational mobility: movement of relationships, values and mindsets that indicate closed or open interpersonal relationships, etc.
Apart from that interesting region of Latin America, the results speak for themselves – people’s perceptions of relational mobility seem to be quite accurate!
NOTE: Hover or tap the trend line for the p-value.
Data download via the Open Science Framework
- CSV: convergent_vars.csv
- Excel workbook: convergent_vars.xlsx
- SPSS datafile: convergent_vars.sav
Source: Thomson et al. (2018), Table S6
Relational Mobility and Cultural Variables
How is relational mobility related to previously established cultural dimensions?
Researchers have identified many ways in which people from different regions of the world differ. Shared values, mindsets, ways of understanding the self, and concepts about society are some ways in which we differ.
We argue that in low relational mobility societies, people should have mindsets and shared values that reflect the relatively closed, long-term nature of interpersonal relationships in those societies: interdependence, collectivistic worldviews, and strong norm enforcement and hierarchies are some that come to mind.
On the other hand, reflecting relative freedom to pursue one’s own relationships voluntarily, higher relational mobility should be associated with more individualistic, independent, and egalitarian values.
Indeed, results seem to suggest that this is the case.
NOTE: Hover or tap the trend line for the p-value.
Data download via the Open Science Framework
- CSV: cultural_vars.csv
- Excel workbook: cultural_vars.xlsx
- SPSS datafile: cultural_vars.sav
Source: Thomson et al. (2018), Table S8
Psychological and Behavioral Outcomes of Relational Mobility
What happens to humans’ behavior and mindsets when relational mobility is high or low?
Researchers argue that as relational mobility increases, people become more attuned to 1) seeking out high quality, attractive relationships, and 2) trying hard to keep the relationships they like!
Therefore, high relational mobility is associated with more active interpersonal behaviors and mindsets that support those behaviors.
NOTE: Hover or tap the trend line for the p-value.
Data download via the Open Science Framework
- CSV: outcomes.csv
- Excel workbook: outcomes.xlsx
- SPSS datafile: outcomes.sav
Source: Thomson et al. (2018), Table S9
Antecedents to Relational Mobility
What makes some societies high and some low in relational mobility?
Overall, it seems that societies with more pressure against survival and more “collaborative” ways of farming and agriculture tend to be lower in relational mobility.
Here, we draw on two seminal theories on how distal social ecologies impact human society. First, Gelfand et al.’s (2011) widely influential work focused on ways historical and ecological threats impact the tightness of norms (see Cultural Tightness in the Cultural Variables section above). We explored many of the same ecological variables as Gelfand et al. (2011) to see how this affects relational mobility. Second, we drew on subsistence style theory–see Talhelm et al. (2014) and Uskul et al. (2008)–to see what impact this had on relational mobility.
We found more threats and more stable subsistence styles seem to make some societies more close-knit, closed to outsiders, and require people to coordinate and cooperate more closely. Societies like this seem to afford less freedom and opportunity to meet and change relationships.
The stand-out exception, once again, is Latin America. These societies display the behavior and mindsets we’d expect from high relational mobility societies. But, it seems they certainly didn’t get their relational mobility from their ecological and historical background. This is a fascinating avenue for further work!
NOTE: Hover or tap the trend line for the p-value.
Data download via the Open Science Framework
- CSV: antecedents.csv
- Excel workbook: antecedents.xlsx
- SPSS datafile: antecedents.sav
Source: Thomson et al. (2018), Table S10